You can filter the results of the details on any page by entering values into the enabled filter criteria and clicking the
Apply Filter. For example, in the image below,
you can select a specific county and/or first and/or last name to filter the content of the grid.

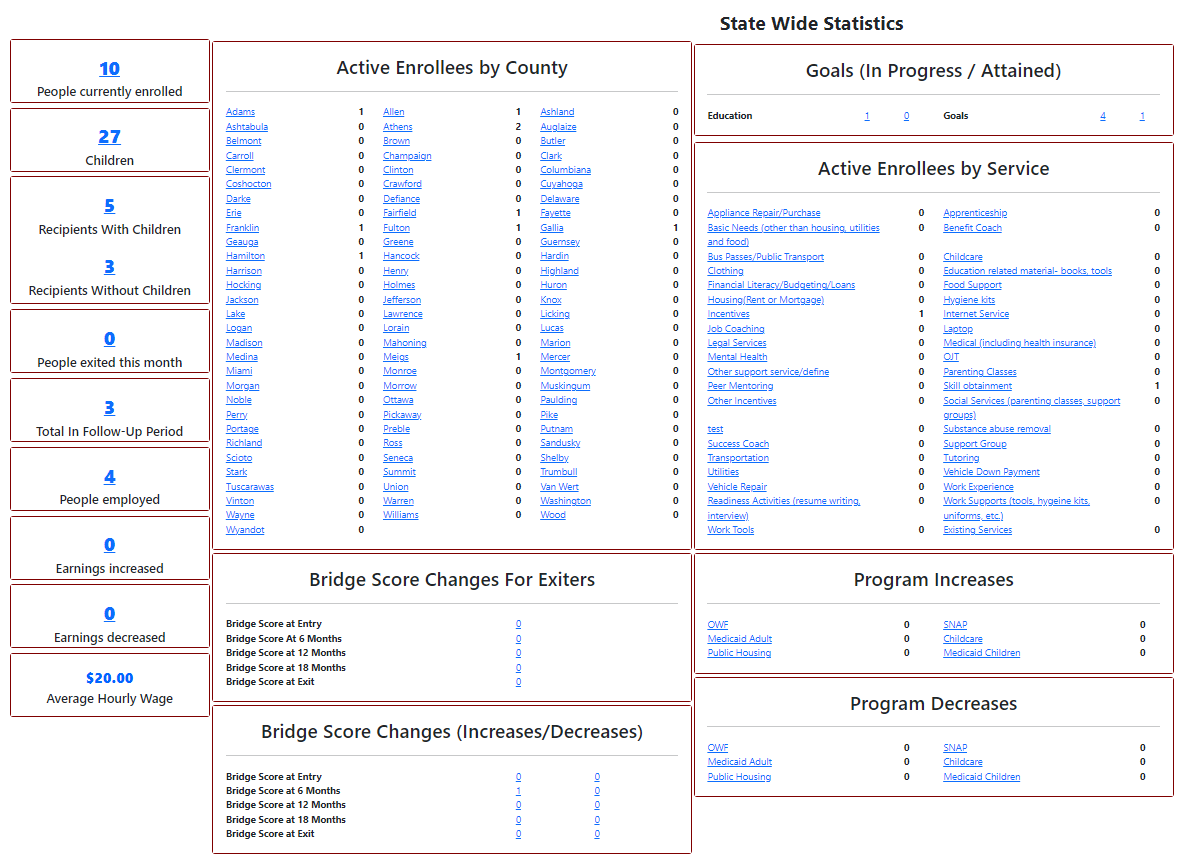
This tile displays the number of enrollees currently active in BBCT. Clicking on the link will display a list of active enrollees.
This tile displays the number of children for all currently active enrollees in BBCT. Clicking on the link will display a list of active enrollees and the number of children.
This tile displays the number of recipients with children for all currently active enrollees in BBCT. Clicking on the link will display a list of active enrollees with their number of children.
This tile displays the number of recipients without children for all currently active enrollees in BBCT. Clicking on the link will display a list of active enrollees without children.
This tile displays the number of recipients exited this month. Clicking on the link will display a list of recipients exited this month.
This tile displays the number of recipients who have positively exited the program within the last 180 days. Clicking on the link will display a list of enrollees who exited this month.
This tile displays the number of active enrollees who are employed. Clicking on the link will display a list of enrollees who are employed.
This tile displays the number of enrollees who had an earning increase from the previous month. Clicking on the link will display a list of enrollees who had an earning increase.
This tile displays the number of enrollees who had an earning decrease from the previous month. Clicking on the link will display a list of enrollees who had an earning decrease.
This tile displays the average wage of all currently employeed enrollees during the month. This number is data only and not a link.
This tile displays the number of active enrollees in each county. Clicking on the a county link will display a list of active enrollees for the selected county.
This tile displays the bridge score average for exiters if their scores changed from previous data periods. Clicking on a link will display a list of recipients and their bridge scores for the associated time period.
This tile displays the counts of positive or negative bridge score changes from previous data periods for recipients. Clicking on a link will display a list of recipients and their bridge scores for the associated time period.
This tile displays the counts of education or goals, either in progress or attained, for current enrollees. Clicking on a link will display a list of recipients and the associated education or goals.
This tile displays the number of active enrollees for each service. Clicking on the a county link will display a list of active enrollees for the selected service.
This tile displays the number of enrollees that had an increase in program benefits compared to the previous quarter. Clicking on a program link will display a list of enrollees who had a program decrease.
This tile displays the number of enrollees that had an decrease in program benefits compared to the previous quarter. Clicking on a program link will display a list of enrollees who had a program decrease.